How to Use Technical Analysis to Trade Crypto Smartly
How to Use Technical Analysis to Trade Crypto Smartly

How to Use Technical Analysis to Trade Crypto Smartly
Can a systematic approach to analyzing market trends improve your cryptocurrency investments? As the cryptocurrency market continues to grow in popularity, the need for smart trading strategies has become increasingly important.
Technical analysis has emerged as a crucial tool for investors seeking to make informed decisions in this volatile market. By examining historical price data and market trends, traders can identify patterns that may predict future price movements.

The application of technical analysis in cryptocurrency trading offers a disciplined approach to navigating the market’s complexities. Understanding how to apply these techniques can significantly enhance your trading outcomes.
Key Takeaways
- Technical analysis is essential for making informed cryptocurrency investment decisions.
- Historical price data and market trends are critical components of technical analysis.
- Applying technical analysis can enhance trading outcomes in the volatile cryptocurrency market.
- Cryptocurrency traders benefit from a systematic approach to market analysis.
- Smart trading strategies are crucial in the rapidly evolving cryptocurrency landscape.
Understanding the Fundamentals of Technical Analysis in Cryptocurrency Markets
In the rapidly evolving world of cryptocurrency, technical analysis serves as a vital framework for making informed trading decisions. This method of analysis has become indispensable for traders seeking to understand the complexities of cryptocurrency price movements.
What Is Technical Analysis and Why It Matters for Crypto
Technical analysis involves examining past market data, primarily price and volume, to forecast future price movements. It is particularly relevant in cryptocurrency markets due to their volatility and the absence of fundamental valuation methods. Technical analysis helps traders identify trends and patterns, enabling them to make more informed decisions.
The Difference Between Technical and Fundamental Analysis
While fundamental analysis focuses on a project’s intrinsic value by analyzing factors like technology, team, and market demand, technical analysis concentrates on chart patterns and indicators. Cryptocurrency markets often react to both fundamental news and technical patterns, making a combination of both analyses beneficial for traders.
The Psychology Behind Price Movements in Crypto Markets
Market psychology plays a significant role in cryptocurrency price movements. Fear, greed, and speculation drive market sentiment, influencing prices. Understanding these psychological factors can help traders anticipate potential market shifts. For instance, a table illustrating common psychological triggers and their effects on cryptocurrency prices can provide valuable insights:
| Psychological Trigger | Effect on Price |
|---|---|
| Fear of Missing Out (FOMO) | Price Increase |
| Market Panic | Price Drop |
| Speculative Buying | Price Surge |
Essential Chart Types for Crypto Technical Analysis
Chart types play a vital role in technical analysis, helping traders navigate the volatile crypto landscape. Different chart types offer unique insights into market trends and price movements.
Candlestick Charts and Their Significance
Candlestick charts are a popular choice among crypto traders due to their ability to convey detailed price information. They display the open, high, low, and close prices for a specific period, providing insights into market sentiment and potential trend reversals.
Line Charts vs. Bar Charts: When to Use Each
Line charts are useful for identifying overall trends by connecting closing prices over time. Bar charts, on the other hand, provide more detailed information by displaying the open, high, low, and close prices for each period. The choice between line and bar charts depends on the trader’s specific needs and analysis goals.
Advanced Chart Types for Sophisticated Analysis
Advanced chart types, such as Heikin-Ashi and Renko charts, offer additional insights for sophisticated analysis. Heikin-Ashi charts help filter out market noise, while Renko charts focus on price movements, ignoring time. These charts can be particularly useful for experienced traders looking to refine their strategies.
| Chart Type | Description | Use Case |
|---|---|---|
| Candlestick | Displays open, high, low, close prices | Identifying trend reversals |
| Line | Connects closing prices over time | Identifying overall trends |
| Bar | Displays open, high, low, close prices | Detailed price analysis |
Key Technical Indicators Every Crypto Trader Should Master
Mastering technical indicators is crucial for crypto traders to make informed decisions. Technical indicators are mathematical calculations based on the price, volume, or open interest of a security or contract, providing valuable insights into market trends and potential future movements.
Trend Indicators: Moving Averages and MACD
Trend indicators help traders identify the direction and strength of market trends. Moving Averages smooth out price data, making it easier to spot trends. The MACD (Moving Average Convergence Divergence) indicator is another powerful tool that combines two moving averages to identify potential buy and sell signals.
Momentum Indicators: RSI and Stochastic Oscillator
Momentum indicators measure the speed and strength of price movements. The Relative Strength Index (RSI) compares the magnitude of recent gains to recent losses, helping traders identify overbought or oversold conditions. The Stochastic Oscillator compares the closing price to its price range over a given period, providing insights into potential trend reversals.
Volume Indicators and Their Importance
Volume indicators analyze trading volume to gauge market sentiment. High volume often accompanies significant price movements, confirming the strength of a trend. By analyzing volume, traders can identify potential breakouts or reversals, making more informed trading decisions.
Recognizing Powerful Chart Patterns in Cryptocurrency Markets
Understanding chart patterns is essential for navigating the volatile cryptocurrency markets effectively. These patterns provide traders with valuable insights into market trends and potential reversals, enabling them to make more informed investment decisions.
Reversal Patterns: Head and Shoulders, Double Tops and Bottoms
Reversal patterns signal potential changes in market direction. The Head and Shoulders pattern is one of the most reliable reversal indicators, characterized by a peak (head) flanked by two smaller peaks (shoulders). Double Tops and Bottoms are another significant reversal pattern, indicating a potential shift in market sentiment.
Continuation Patterns: Flags, Pennants, and Triangles
Continuation patterns indicate that the current trend is likely to continue. Flags and Pennants are short-term continuation patterns that form after a significant price move, signaling a brief pause before the trend resumes. Triangles are another type of continuation pattern, formed by converging trend lines, which can indicate a buildup of energy before a significant price movement.
Japanese Candlestick Patterns for Crypto Trading
Japanese Candlestick patterns offer detailed insights into market psychology. Patterns such as Hammer, Shooting Star, and Engulfing patterns are used to predict potential reversals or continuations. These patterns are particularly useful in cryptocurrency trading, where market sentiment can shift rapidly.
Support and Resistance: The Backbone of Crypto Trading Strategies
In the realm of cryptocurrency trading, support and resistance levels form the foundation of technical analysis. These levels are crucial for traders to understand market dynamics and make informed decisions.
Identifying Key Support and Resistance Levels
Support and resistance levels are identified by analyzing historical price data to find areas where the price has repeatedly reversed or consolidated. Support levels are where the price tends to stop falling, while resistance levels are where it tends to stop rising. Traders use these levels to predict potential price movements and adjust their strategies accordingly.
Using Fibonacci Retracement in Crypto Markets
Fibonacci retracement is a tool used to identify potential support and resistance levels based on the Fibonacci sequence. By drawing Fibonacci levels on a chart, traders can identify areas where the price is likely to reverse or consolidate. This technique helps traders anticipate potential price movements and set appropriate stop-loss and take-profit levels.
Dynamic Support and Resistance with Moving Averages
Moving averages can serve as dynamic support and resistance levels, providing traders with a more nuanced view of market trends. Short-term moving averages can act as support in an uptrend, while long-term moving averages can serve as resistance in a downtrend. By combining moving averages with other technical indicators, traders can develop more effective trading strategies.
Developing Effective Trading Strategies Using Technical Analysis
To navigate the complex world of crypto trading, one must develop a robust technical analysis strategy. Effective trading strategies are the backbone of successful cryptocurrency trading, enabling traders to make informed decisions in a volatile market.
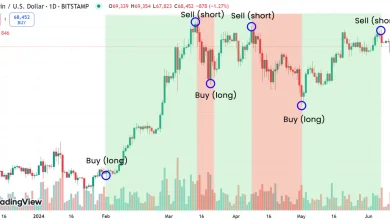
Trend-Following Strategies for Crypto Markets
Trend-following strategies involve identifying and capitalizing on the direction of market trends. In crypto markets, this can be achieved by using indicators such as Moving Averages (MA) and the Moving Average Convergence Divergence (MACD). These tools help traders identify the strength and direction of trends, allowing them to ride the momentum and maximize profits.
For instance, a simple trend-following strategy could involve using a short-term MA (e.g., 50-day MA) and a long-term MA (e.g., 200-day MA). When the short-term MA crosses above the long-term MA, it’s a bullish signal; conversely, when it crosses below, it’s bearish. This strategy can be particularly effective in strongly trending markets.
Counter-Trend and Reversal Trading Approaches
Counter-trend and reversal trading strategies focus on identifying potential reversals in market trends. These approaches require a deep understanding of market psychology and technical indicators that signal potential trend reversals, such as the Relative Strength Index (RSI) and candlestick patterns.
For example, traders might use the RSI to identify overbought or oversold conditions. An RSI reading above 70 typically indicates overbought conditions, suggesting a potential reversal to the downside. Conversely, an RSI below 30 indicates oversold conditions, suggesting a potential reversal to the upside. Combining RSI with candlestick patterns like the hammer or shooting star can further enhance the accuracy of reversal signals.
Combining Multiple Indicators for Confirmation
One of the most effective ways to enhance the reliability of trading signals is by combining multiple technical indicators. This approach helps in confirming trading decisions and reducing the risk of false signals. For instance, a trader might use a combination of trend indicators (like MA or MACD) and momentum indicators (like RSI or Stochastic Oscillator) to confirm a trading signal.
| Indicator Type | Example Indicators | Purpose |
|---|---|---|
| Trend Indicators | MA, MACD | Identify trend direction and strength |
| Momentum Indicators | RSI, Stochastic Oscillator | Measure the speed of price movements |
| Volume Indicators | Volume, OBV | Confirm trend strength and identify divergences |
By combining these indicators, traders can develop a more comprehensive view of the market, leading to more informed and confident trading decisions.
Risk Management Techniques for Crypto Trading
To navigate the volatile crypto markets, traders must employ sound risk management techniques. Effective risk management is the cornerstone of a successful trading strategy, enabling traders to minimize losses and maximize gains.
Setting Appropriate Stop-Loss and Take-Profit Levels
One of the fundamental risk management techniques is setting appropriate stop-loss and take-profit levels. A stop-loss order automatically sells a cryptocurrency when it falls to a certain price, limiting potential losses. Conversely, a take-profit order sells a cryptocurrency when it reaches a predetermined high, securing profits. For instance, a trader might set a stop-loss order at 10% below the purchase price and a take-profit order at 20% above it.
| Order Type | Purpose | Example Setting |
|---|---|---|
| Stop-Loss | Limit losses | 10% below purchase price |
| Take-Profit | Secure profits | 20% above purchase price |
Position Sizing and Portfolio Allocation
Another critical aspect of risk management is position sizing, which involves determining the appropriate amount of capital to allocate to a particular trade. This helps in managing exposure and potential losses. A common rule of thumb is to risk no more than 1-2% of the total trading capital on a single trade. Portfolio allocation strategies, such as diversifying across different cryptocurrencies, can also mitigate risk.
Managing Emotional Biases in Technical Trading
Traders must also manage emotional biases that can lead to impulsive decisions. Fear and greed are common biases that can result in premature selling or over-investing. Implementing a trading plan and sticking to it can help mitigate these biases. Additionally, using technical indicators and setting clear entry and exit points can reduce the influence of emotions on trading decisions.
By incorporating these risk management techniques into their trading strategies, crypto traders can better navigate the inherent volatility of the cryptocurrency markets.
Top Technical Analysis Tools and Platforms for Cryptocurrency Traders
Cryptocurrency traders now have access to a wide array of technical analysis tools to enhance their trading strategies. These tools range from professional charting software to mobile apps and automated screeners, each catering to different aspects of technical analysis.
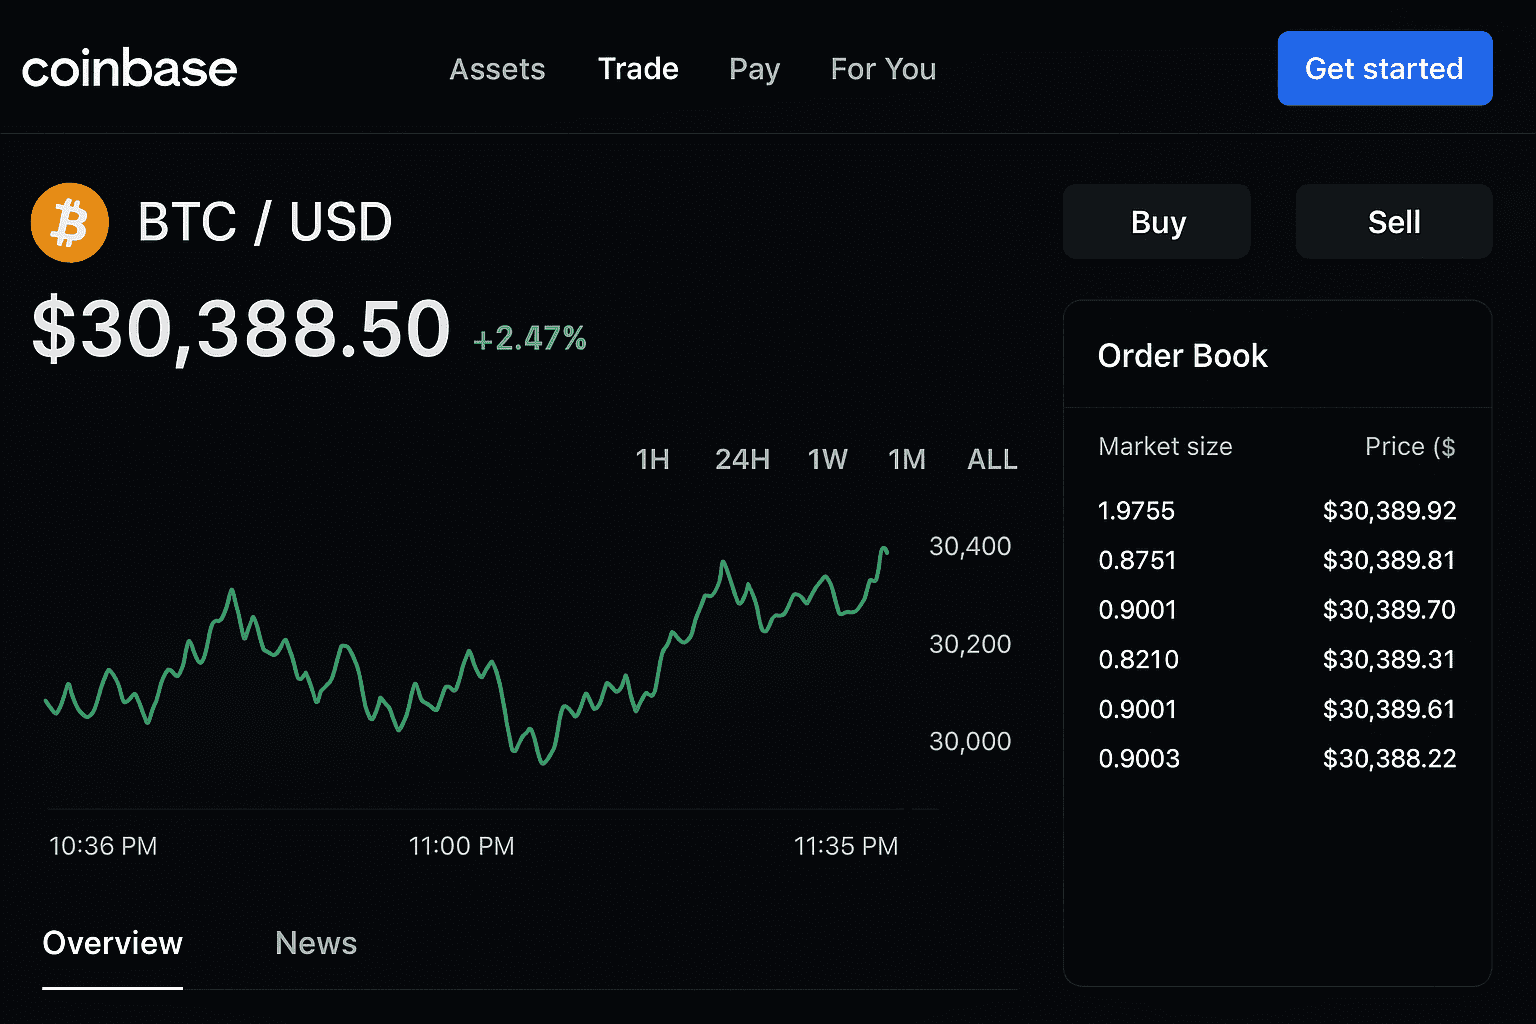
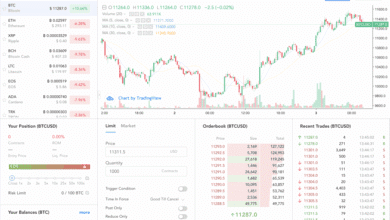
Professional Charting Software for Crypto Analysis
Professional charting software is indispensable for serious cryptocurrency traders. Platforms like TradingView offer advanced charting capabilities, including customizable indicators and drawing tools. Coinigy is another powerful tool that integrates with multiple exchanges, providing real-time data and alerts. These platforms enable traders to perform in-depth analysis and make informed decisions.
Mobile Apps for On-the-Go Technical Analysis
For traders who need to stay connected on the go, mobile apps have become essential. Apps like Blockfolio and CryptoWatch offer robust technical analysis features, including real-time price tracking, customizable alerts, and basic charting tools. These apps allow traders to monitor their positions and react quickly to market changes.
“The best way to get started is to quit talking and begin doing.” –
Automated Tools and Screeners for Crypto Opportunities
Automated tools and screeners have revolutionized the way traders identify potential trading opportunities. Platforms like CoinMarketAlert provide customizable alerts for price movements and other market conditions. CryptoSlate offers a range of tools, including a crypto screener that helps traders find undervalued or overbought assets. These tools save time and help traders stay ahead of the market.
- Automated alerts for price movements and trends
- Customizable screeners for specific market conditions
- Integration with multiple exchanges for real-time data
Common Technical Analysis Mistakes and How to Avoid Them
Effective technical analysis is crucial for successful crypto trading, yet many traders fall into common traps. By understanding these pitfalls, traders can refine their strategies and improve their outcomes.
Overcomplicating Your Analysis with Too Many Indicators
One of the most common mistakes in technical analysis is overcomplicating your charts with too many indicators. This can lead to analysis paralysis, where the sheer amount of data makes it difficult to make a decision. To avoid this, focus on a few key indicators that align with your trading strategy.
Ignoring Market Context and Broader Trends
Ignoring the broader market context can lead to misinterpretation of technical signals. It’s essential to consider the overall market trend and external factors that may impact price movements. Staying informed about market news and sentiment can help you make more accurate predictions.
Failing to Adapt Technical Strategies to Crypto Volatility
Crypto markets are known for their volatility, and failing to adapt your technical strategies to this environment can be costly. Adjusting your risk management and being prepared for rapid price movements is crucial. Consider using indicators that are sensitive to volatility, such as the Bollinger Bands.
| Common Mistake | Impact on Trading | Solution |
|---|---|---|
| Overcomplicating analysis | Analysis paralysis | Focus on key indicators |
| Ignoring market context | Misinterpretation of signals | Consider broader trends and news |
| Failing to adapt to volatility | Unexpected losses | Adjust risk management and use volatility-sensitive indicators |
By being aware of these common technical analysis mistakes and taking steps to avoid them, crypto traders can enhance their trading performance and navigate the complex cryptocurrency markets more effectively.
Conclusion: Integrating Technical Analysis into Your Crypto Trading Journey
Integrating technical analysis into your cryptocurrency trading practices can significantly enhance your trading decisions. By understanding the fundamentals of technical analysis, utilizing essential chart types, and mastering key technical indicators, you can develop effective trading strategies.
Recognizing powerful chart patterns, identifying support and resistance levels, and managing risk are crucial elements of a successful crypto trading journey. As you continue to refine your technical analysis skills, you will be better equipped to navigate the volatile cryptocurrency markets.
By combining technical analysis with robust risk management techniques and staying informed about market trends, you can create a comprehensive trading plan. This integrated approach will help you make more informed decisions and potentially improve your trading outcomes.
As you move forward in your crypto trading journey, remember to continually adapt and refine your trading strategies to suit the ever-changing market conditions. With persistence and practice, you can become a proficient technical analysis practitioner and enhance your overall trading performance.
FAQ
What is technical analysis, and how is it applied in cryptocurrency trading?
Technical analysis is a method of evaluating securities by analyzing statistical patterns and trends in their price movements and other market-related data. In cryptocurrency trading, technical analysis is used to predict future price movements based on historical data, helping traders make informed decisions.
How do technical indicators work in cryptocurrency markets?
Technical indicators are calculations based on the price and/or volume of a cryptocurrency that are used to predict its future price movements. They work by analyzing historical data to identify patterns and trends, which can then be used to inform trading decisions. Examples include moving averages, relative strength index (RSI), and Bollinger Bands.
What is the difference between a line chart and a candlestick chart in technical analysis?
A line chart displays the closing prices of a cryptocurrency over time, providing a simple view of its price trend. A candlestick chart, on the other hand, displays the high, low, open, and close prices for each period, offering more detailed information about price movements and market sentiment.
How can I identify support and resistance levels in cryptocurrency markets?
Support and resistance levels can be identified by analyzing historical price data to find areas where the price has consistently bounced back (support) or been rejected (resistance). These levels can be used to inform trading decisions, such as setting stop-loss and take-profit levels.
What is Fibonacci retracement, and how is it used in cryptocurrency trading?
Fibonacci retracement is a technical analysis tool used to identify potential support and resistance levels by drawing lines at specific price levels based on the Fibonacci sequence. In cryptocurrency trading, Fibonacci retracement is used to predict potential price reversals and identify areas of support and resistance.
How can I manage risk when trading cryptocurrencies using technical analysis?
Risk management in cryptocurrency trading involves setting stop-loss and take-profit levels, position sizing, and managing emotional biases. Technical analysis can help inform these decisions by identifying potential support and resistance levels and predicting price movements.
What are some common mistakes made in technical analysis, and how can they be avoided?
Common mistakes in technical analysis include overcomplicating analysis with too many indicators, ignoring market context and broader trends, and failing to adapt technical strategies to cryptocurrency volatility. These mistakes can be avoided by keeping analysis simple, staying informed about market trends, and being flexible in response to changing market conditions.
What are some top technical analysis tools and platforms for cryptocurrency traders?
Some top technical analysis tools and platforms for cryptocurrency traders include professional charting software like TradingView, mobile apps like CryptoSpectator, and automated tools like CryptoHopper. These tools provide a range of features, including real-time data, customizable charts, and alerts.
How can I develop effective trading strategies using technical analysis in cryptocurrency markets?
Developing effective trading strategies using technical analysis involves combining multiple indicators and techniques, such as trend-following, counter-trend, and reversal trading approaches. It also involves staying informed about market trends and adapting strategies to changing market conditions.
What is algorithmic trading, and how is it used in cryptocurrency markets?
Algorithmic trading involves using computer programs to automate trading decisions based on predefined rules. In cryptocurrency markets, algorithmic trading is used to execute trades quickly and efficiently, taking advantage of market opportunities as they arise.
How can I use swing trading strategies in cryptocurrency markets?
Swing trading involves holding positions for a shorter period than investing, but longer than day trading. In cryptocurrency markets, swing trading strategies can be used to take advantage of price movements over a few days or weeks, using technical analysis to identify potential entry and exit points.